
How to Display Custom Data on a TradingView Chart (Tables, Labels and Plots in Pine Script)
Charts look clean. Indicators look familiar.
But what happens when you want to place your own data directly on the chart, not just price or standard indicators?
That’s where many traders pause.
So here’s the real question:
How far can Pine Script go when it comes to custom data visualization?
Pine Script allows traders to visualize custom data using tables, labels, plots, and drawing objects. It gives you strong flexibility for turning calculated values, scores and metrics into something you can read at a glance. This guide explains how to build these visuals step-by-step, includes real code examples, highlights limitations, and connects how PineGen AI can improve the workflow.
1. Why Custom Data Visualization Matters
Most traders stick to default indicators, but custom data gives you more control,like:
-
strategy performance metricss
-
calculated signals
-
model outputs
-
multi-condition scoring systems
Instead of switching tools, you can bring everything into one visual space.
If you want everything in one place, our Pine Script v6 guide covers the editor, script types and the Strategy Tester.
2. What Pine Script Can Draw on a Chart
Pine Script runs inside TradingView and focuses on rendering data on charts.
You can:
-
draw labels, lines, and boxes
-
display structured data using tables
-
plot custom values directly
Everything you draw comes from values your script calculates on the chart’s own bars. The wider picture of what the language can do is in Pine Script explained.
3. Visualization Methods in Pine Script
- Tables
Best for structured data like metrics or dashboards.
- Labels
Used to mark events like signals or conditions.
- Plots
Used for continuous indicators or overlays.
- Background Coloring
Used to highlight market conditions visually.
Which Visualization Method Should You Use?
Pick the method from the shape of the data, not from habit:
- One value per bar that you want to follow over time (a score, an average): use plot(). It keeps history, so you can see how the value changed.
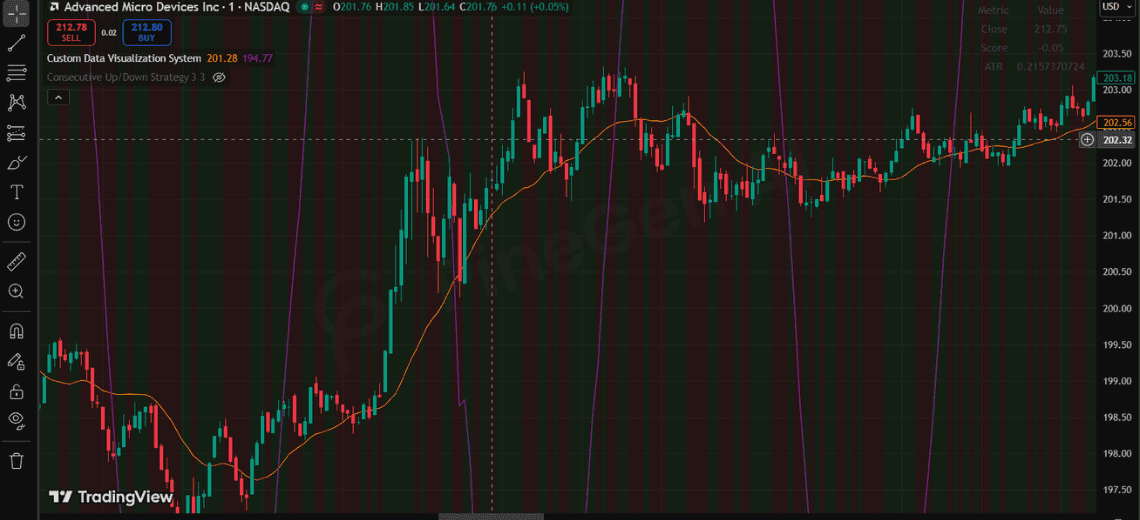
- A handful of named values you want to read right now (close, score, ATR, win rate): use a table on the last bar. It stays in a fixed screen corner and does not move with price.
- A one-time event on a specific bar (a signal, a crossover): use a label. Draw it only when the condition fires so the chart does not fill with text.
- A market condition that lasts across many bars (bullish zone, high volatility): use bgcolor(). It shades the whole stretch without adding objects.
Mixing methods works best when each has one job: for example a plot for the score, a table for the current readout, a label for the signal bar, and background color for the regime.
Table Formatting Tips
Set the corner with position.top_right, position.bottom_left and similar, and size the table with its column and row counts in table.new(). Use text_color and bgcolor on table.cell() so headers stand apart from values. Update cells only on barstate.islast so the table is not redrawn on every historical bar. A small example:
var table t = table.new(position.top_right, 2, 2)
if barstate.islast
    table.cell(t, 0, 0, "Metric", text_color=color.white, bgcolor=color.gray)
    table.cell(t, 1, 0, "Value", text_color=color.white, bgcolor=color.gray)
4. Step-by-Step Implementation
Define Data
customScore = close - open
trend = ta.sma(close, 20)
Choose Visualization
Table → structured data
Label → events
Plot → continuous signals
5. Full Code Example
//@version=6
indicator("Custom Data Visualization System", overlay=true)

// ----------------------
// DATA
// ----------------------
customScore = close - open
trend = ta.sma(close, 20)
volatility = ta.atr(14)

// ----------------------
// TABLE
// ----------------------
var table t = table.new(position.top_right, 2, 4)

if barstate.islast
    table.cell(t, 0, 0, "Metric")
    table.cell(t, 1, 0, "Value")

    table.cell(t, 0, 1, "Close")
    table.cell(t, 1, 1, str.tostring(close))

    table.cell(t, 0, 2, "Score")
    table.cell(t, 1, 2, str.tostring(customScore))

    table.cell(t, 0, 3, "ATR")
    table.cell(t, 1, 3, str.tostring(volatility))

// ----------------------
// LABELS (avoid spam)
// ----------------------
if customScore > 0 and barstate.islast
    label.new(bar_index, high, "Bullish", color=color.green)

if customScore  0 ? color.new(color.green, 90) : color.new(color.red, 90))

// ----------------------
// ALERTS
// ----------------------
alertcondition(customScore > 0 and close > trend, "Bullish Alert", "Bullish setup")
alertcondition(customScore < 0 and close < trend, "Bearish Alert", "Bearish setup")
6. Limitations You Should Know
-
Object limits for labels, lines, and tables
-
Performance issues if visuals are overused
-
Works only inside TradingView Performance limits matter for scanners too; see building a custom scanner. To work with outside systems, external API integration explains the alert-and-webhook route. If you want to send your values out of TradingView to another system instead of showing them on the chart, that is a different job, covered in external API integration, which explains the alert-and-webhook route.
7. PineGen AI Workflow Advantage
Writing Pine Script manually can get repetitive.
PineGen AI helps by:
-
generating Pine Script faster
-
reducing syntax errors
-
structuring visualization logic
-
speeding up strategy development Want to try this yourself? Build with PineGen AI and review the script on the chart before you trade it.
8. Conclusion
Visualizing custom data in TradingView is about working within Pine Script’s structure, not forcing it beyond limits.
Tables, labels, and plots each serve a specific purpose, and when combined properly, they can turn a chart into a decision-making system.
If you want to reduce manual coding effort and build cleaner, structured Pine Script faster, tools like PineGen AI can make that process smoother.
Start Building TradingView Strategies with PineGen AI Today
Turn trading ideas into validated strategies with AI